Microsoft Excel Denial of Service Vulnerability

CVE-2023-23396

Table of Contents 📜

  1. An unsought vulnerability (TL;DR)
  2. From curiosity to vulnerability
  3. An .XLSX file is a zipped file!
  4. Analyzing chart2.xml to find the cause of the issue
  5. Studying to Understand
  6. A value that shouldn't be considered
  7. Lots of grid lines! Lots and lots!!
  8. The Exploit
  9. What the hell are the threads doing?
  10. Open questions
  11. How to fix the vulnerability
  12. Vulnerability disclosure timeline
  13. Patch analysis
  14. Conclusion
  15. References

An unsought vulnerability (TL;DR) 🪲

Yes, this time I wasn't looking for any vulnerability (and Microsoft Excel has never been one of my targets).
Towards the end of 2022 I taught the first part of the Computer Science course for the students of an Higher Technical Institute (ITS) with which I collaborated and, in November 2022, I assigned them a test concerning the Microsoft Office suite (focused on Word, Excel and PowerPoint).
During the computer test the students could carry out an exercise in Word, one in Excel and one in PowerPoint; each exercise provided a certain score and, by completing all three exercises correctly, it was possible to obtain the maximum score.
The exercise in Excel required to reproduce the content of the following image in an .xlsx file.

During the test everything went well but, once the available time was up, a student was unable to save the exercise he had done in Excel.
Analyzing the system status with the Windows Task Manager, it turned out that the Excel.exe process was using the CPU and almost all the available RAM intensively.
By assigning (from the Task Manager) the High priority to Excel.exe and waiting about ten minutes, Excel.exe was able to complete the save operation by saving the work done by the student in an .xlsx file (but the process was still using the CPU and almost all the available RAM intensively 🤔).
A few days later, checking all the exercises done by the students, I opened the aforementioned .xlsx file; immediately Excel.exe (I was using Microsoft Excel for Microsoft 365 MSO (Version 2202 Build 16.0.14931.20858) 64-bit) began to use the CPU and almost all the RAM memory intensively, causing a Denial of Service condition on the system and preventing me from checking the contents of the spreadsheet in a reasonable time.
Opening the .xlsx file with LibreOffice, no heavy CPU\RAM usage has been reported, and I was able to check the contents of the spreadsheet without problems. This led me to think that the problem wasn't the .xlsx file (eg corrupted file), but the way Excel represented its contents.
At this point I thought it would be interesting to understand what was the exact cause that led Excel.exe to use RAM and CPU so intensively, but I still had other exercises to check and things to do, so I decided to let it go.

From curiosity to vulnerability 🤔➡️🪲

In the following days I remembered the issue concerning the student's .xlsx file; I was curious about the exact cause of the problem.
Thinking that discovering it would lead to something interesting, let it all go would be a wasted opportunity and having more time available, I decided to further investigate the issue.
I opened that .xlsx file again and, looking closely, noticed that the first chart (shown on the left in this image) was visible, but the following image was shown in place of the second chart (shown on the right).

The image above is generally shown as a temporary image, until Excel has performed all the operations necessary to show the graphic element that the user must see (the second chart in this case).
The second chart is never displayed, this means that the operations necessary to display it never end. In fact, the Task Manager reveals that, in the meantime, the Excel.exe process is using the CPU and almost all the available RAM intensively.
At this point I assumed that the problem is caused by some setting of the chart (set by the student during its creation) which induces Excel.exe into a sort of infinite loop during its loading.
But how can I know which chart settings the student has set?

An .XLSX file is a zipped file!

Searching the net I found out that an .xlsx file is a zipped file and its format is an XML-based file format.
In fact, each content (and its related settings) entered by the user into the spreadsheet, is stored in the form of an .xml file.
Each .xml file is stored in a precise folder, and all folders are zipped into an .xlsx file.
To view the different .xml files, just change the .xlsx file extension to .zip and unzip its content.
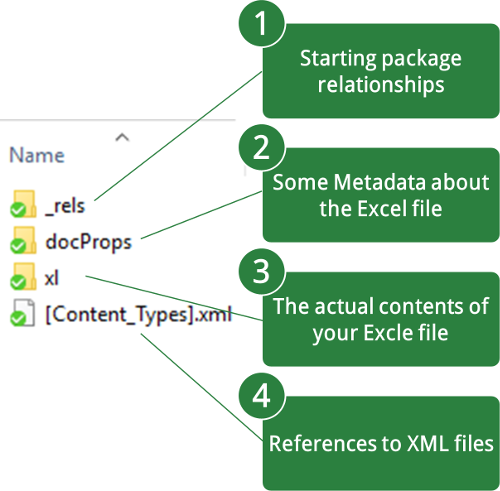
If you unzip the contents of an empty .xlsx file, you should see this:

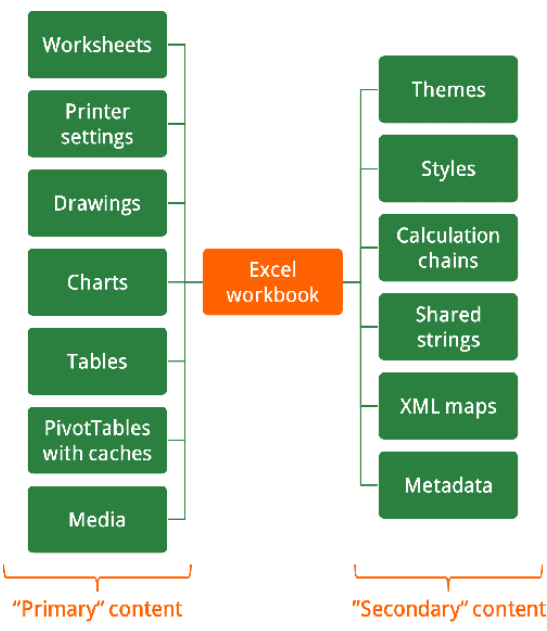
An .xlsx file content can be "Primary" or "Secondary".
A "Primary" content is a content which you can see and access through Excel (eg cell contents, images and charts).
A "Secondary" content is a content you can't see, but still necessary for your Excel file to work (eg metadata and shared strings).

If you're interested to examine in depth the structure and content of an .xlsx file, I suggest you read this article, from which I took the previous two images and summarized some concepts.
For our purposes however, it's not necessary to go further because we're now able to answer the question that ended the previous paragraph.
The chart settings the student has set are easily found by browsing the unzipped folders: they're stored in the xl\charts\chart2.xml file.
The xl folder contains the actual content of the student's .xlsx file, charts contains all the charts created by the student (and all their "secondary" contents, like colors and styles) and chart2.xml is the file containing the chart settings we want to analyze.

Analyzing chart2.xml to find the cause of the issue 🔍

If my assumption is right, it should be possible to find in chart2.xml one or more settings set by the student that trigger the Excel vulnerability. The idea to find these settings is as follows:
  1. Create a new .xlsx file (test.xlsx) containing only a chart of the same type (scatter chart) and with the same values of the one created by the student, without changing its default settings.
  2. Note any differences between chart2.xml and the .xml file containing the settings of the newly created chart (let's call it fakeChart.xml).
  3. Change the fakeChart.xml settings by adding one of those noted in step 2 (or a combination of them).
  4. Recreate a new test.xlsx file containing the fakeChart.xml file created in step 3.
    (Zip all files and folders into test.zip and change its extension to .xlsx).
  5. Open the newly create test.xlsx file in Excel.
  6. Keep repeating steps 3, 4 and 5 until the Excel vulnerability is triggered or all the notes noted in step 2 (or a combination of them) have all been tested.
If, at the end of this procedure, the Excel vulnerability has never been triggered then it means that my assumption is wrong, otherwise it means that it's right and the chart settings that trigger the vulnerability has been found.
Performing this procedure was very time consuming (even because, in the worst case, it's necessary to try all possible combinations of the settings (which are a lot 😞)) but, after many attempts, I did it! I found the two settings that must be present to trigger the Excel vulnerability (if one of the two is missing the vulnerability isn't triggered), proving the correctness of my initial assumption.
The two settings were located within one of the <c:valAx> tags of the chart2.xml file, and are as follows:

...
<c:valAx>
    ...
    <c:max val="1"/> ← first setting
    ...
    <c:delete val="1"/> ← second setting
    ...
</c:valAx>
...

Great! But what do these two lines of code mean? What changes do they make to the chart? And why do they cause Excel to use almost all the available RAM of the system?

PS:
Another idea that you can apply to find the settings that trigger the Excel vulnerability is the one symmetrical to the one previously described: you can reset all the chart settings (one at a time) set by the student by inserting their default values and, if opening the text.xlsx file the vulnerability is no longer triggered, it means that the settings just reset are the ones that trigger it.

Studying to Understand 📖🤔

To answer the previous questions I read the Open XML file formats documentation, studied some classes of the DocumentFormat.OpenXml.Drawing.Charts namespace and observed how the chart changed by changing the values of the two previously indicated <c:valAx> settings (and vice versa).
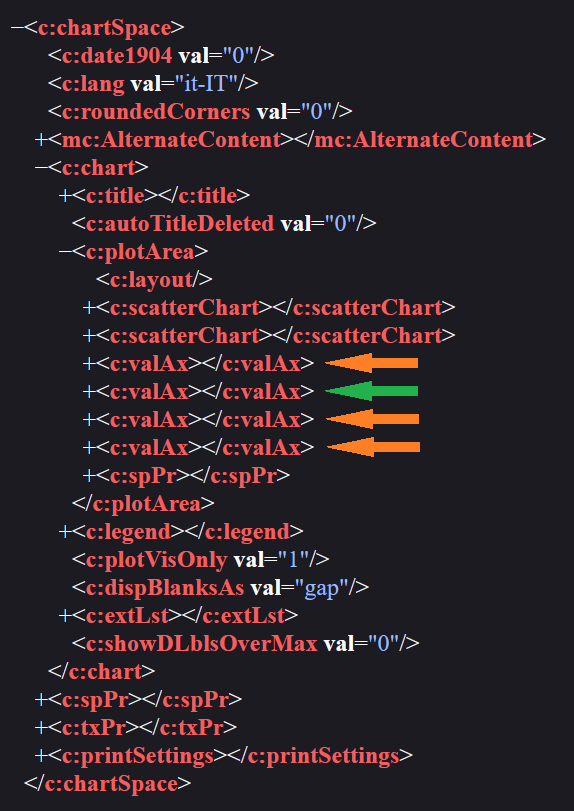
Consider the following XML code of the chart2.xml file:


As you can see, there're four <c:valAx> tags but the two settings can only be found within the second tag (indicated by the green arrow).
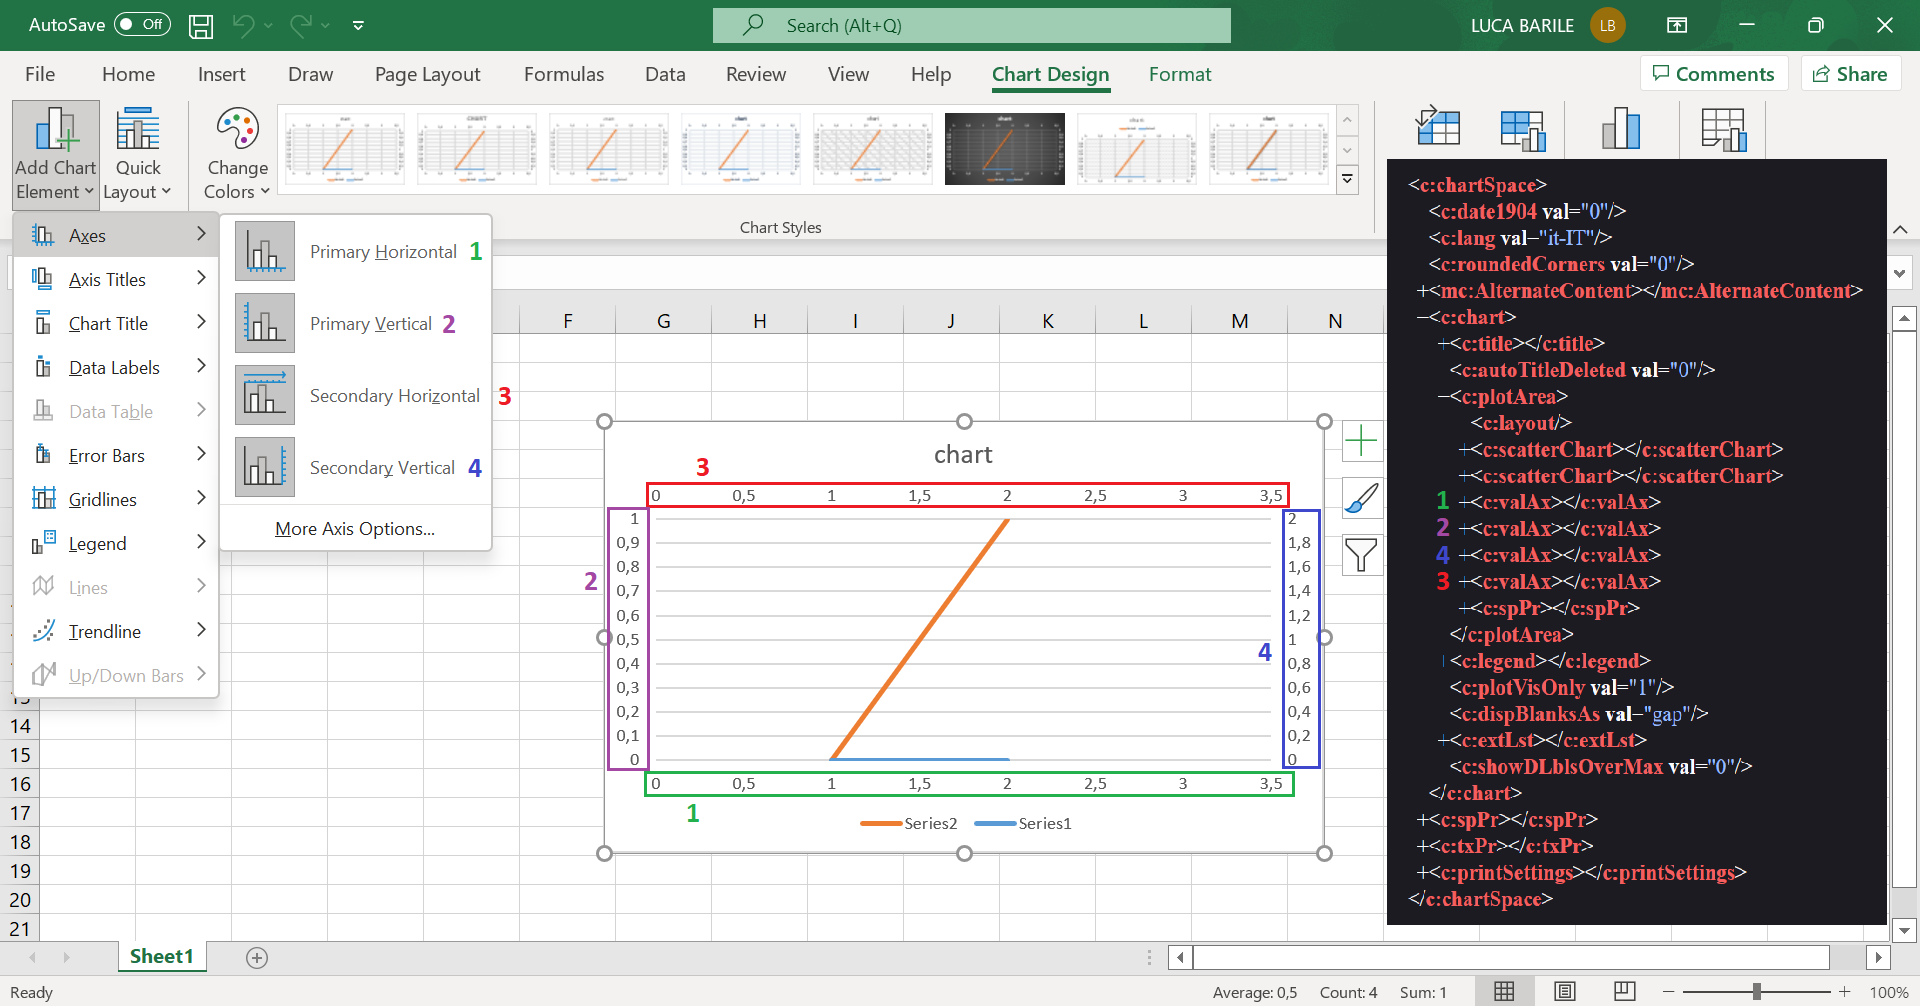
Each <c:valAx> tag specifies a value axis of the chart and chart2.xml contains four because in a generic chart it's possible to have the following four value axes: The <c:valAx> tags seem to be arranged in a precise order and the second tag (the one containing the two settings) is the one relating to the Primary Vertical value axis.
In the following image you can see the correspondences between the four axes and the relative <c:valAx> tags:

The first setting (indicated in the following image by the gray arrow) is specified within the <c:scaling> sub-tag while the second (indicated by the purple arrow) directly within the <c:valAx> tag:


The <c:scaling> sub-tag contains additional axis settings which, in this case, are the orientation of the axis (<c:orientation> tag) and its maximum value (<c:max> tag).
As you can see, the orientation value is set to minMax and this means that the axis values must be displayed from minimum to maximum (the opposite effect can be obtained by setting the value to maxMin); the max value is set to 1 and this means that the maximum value of the axis must be 1 (so, as a consequence, the chart lines exceeding this value won't be shown).
Instead, the <c:delete> tag means that the axis shall be deleted from the chart (that is, it won't be visible to the user).

In a nutshell, the two settings that trigger the Excel vulnerability do nothing but set the maximum value of the Primary Vertical value axis to 1 and delete the axis itself (make it invisible in the chart).
All this doesn't make sense! 😱
It makes no sense to set the maximum value of an axis if the axis is not displayed in the chart... However, this is the cause of the problem, how is this possible? This case is getting more and more interesting 🤔

A value that shouldn't be considered ⛔

To understand something more, I created new .xlsx files (each one with their own scatter chart), setting for each scatter chart different values of the <c:max> and <c:delete> tags (using the Excel User Interface), with the hope of being able to trigger the vulnerability.
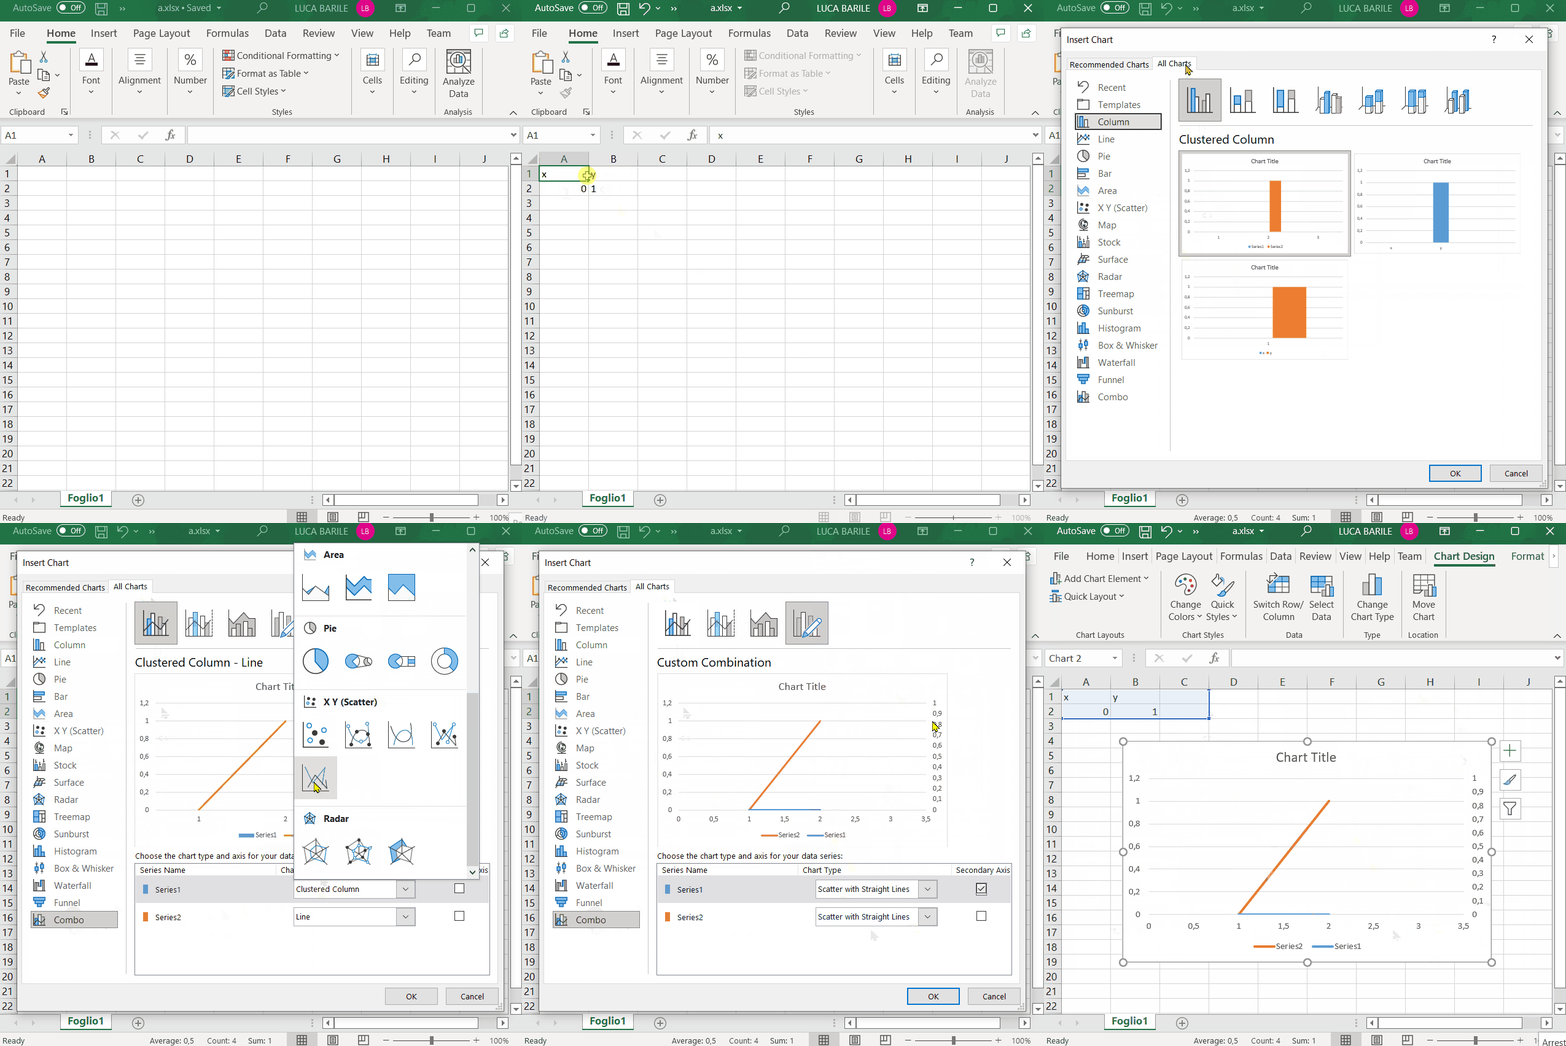
In particular, I used a Combo chart with a Custom Combination. For both the Series (Series1 and Series2) I chose the Chart Type "Scatter with Straight Lines" and, only for Series1, I selected "Secondary Axis".
I decided to use this type of chart, with these settings, because this is the chart that was requested in the assignment and created by the student.
Below you can see how to create this type of chart:

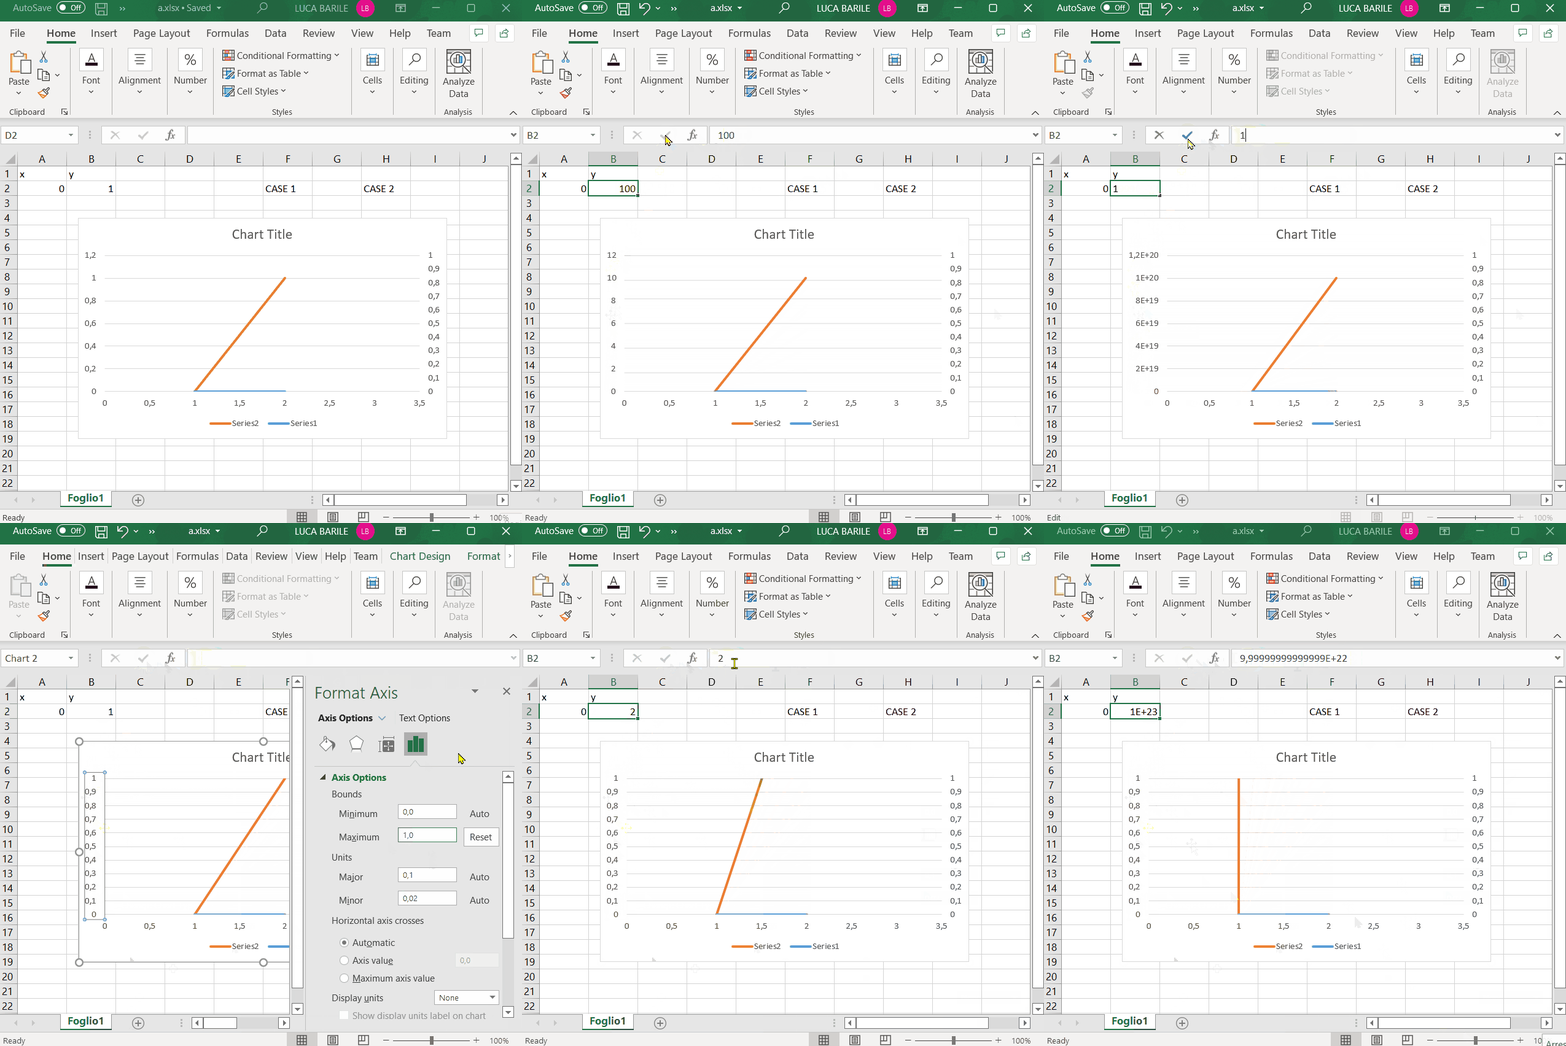
As a starting point I decided to keep the Primary Vertical value axis (which, for simplicity, I'll call PVVA from now on) visible (<c:delete val="0"/>) and see how the chart changed by setting its maximum value (I used 1 as a test) and leaving it unset (in this case its default value is used: Auto).
By setting its maximum value to 1 the <c:max val="1"/> tag is written within the <c:scaling> tag, otherwise it isn't written at all (this means that the <c:max .../> tag can be found within the <c:scaling> tag only if the user set a maximum value of the axis).
Let's call CASE 2 the case in which the maximum value of the PVVA is set to 1 and CASE 1 the case in which its value is left unset (this is the default case used by Excel when the user creates a new chart; in this case Excel sets a maximum value that fits well with the values that are to be represented in the chart).
In CASE 1, when the chart lines exceed the maximum value of the PVVA, Excel automatically changes its scale (and therefore also its maximum value) and draws new equidistant (horizontal) grid lines, so that all lines of the chart are entirely visible.
In CASE 2, when the chart lines exceed the maximum value of the PVVA, the scale doesn't change, the (horizontal) grid lines remain equidistant and only the part of the chart that falls within its maximum value is displayed (therefore some lines of the chart aren't entirely visible).
Below you can see how Excel handles the two cases:

Running these tests the vulnerability hasn't been triggered, but I expected it because the PVVA has always remained visible (<c:delete val="0"/>) while, as we've seen previously, the vulnerability is triggered when it isn't (<c:delete val="1"/>).
So I deleted the PVVA (<c:delete val="1"/>), saved the file (forcing Excel to write the <c:delete val="1"/> tag within the .xml file related to the chart (chart1.xml)) and changed the values of the chart, both in CASE 1 and in CASE 2.
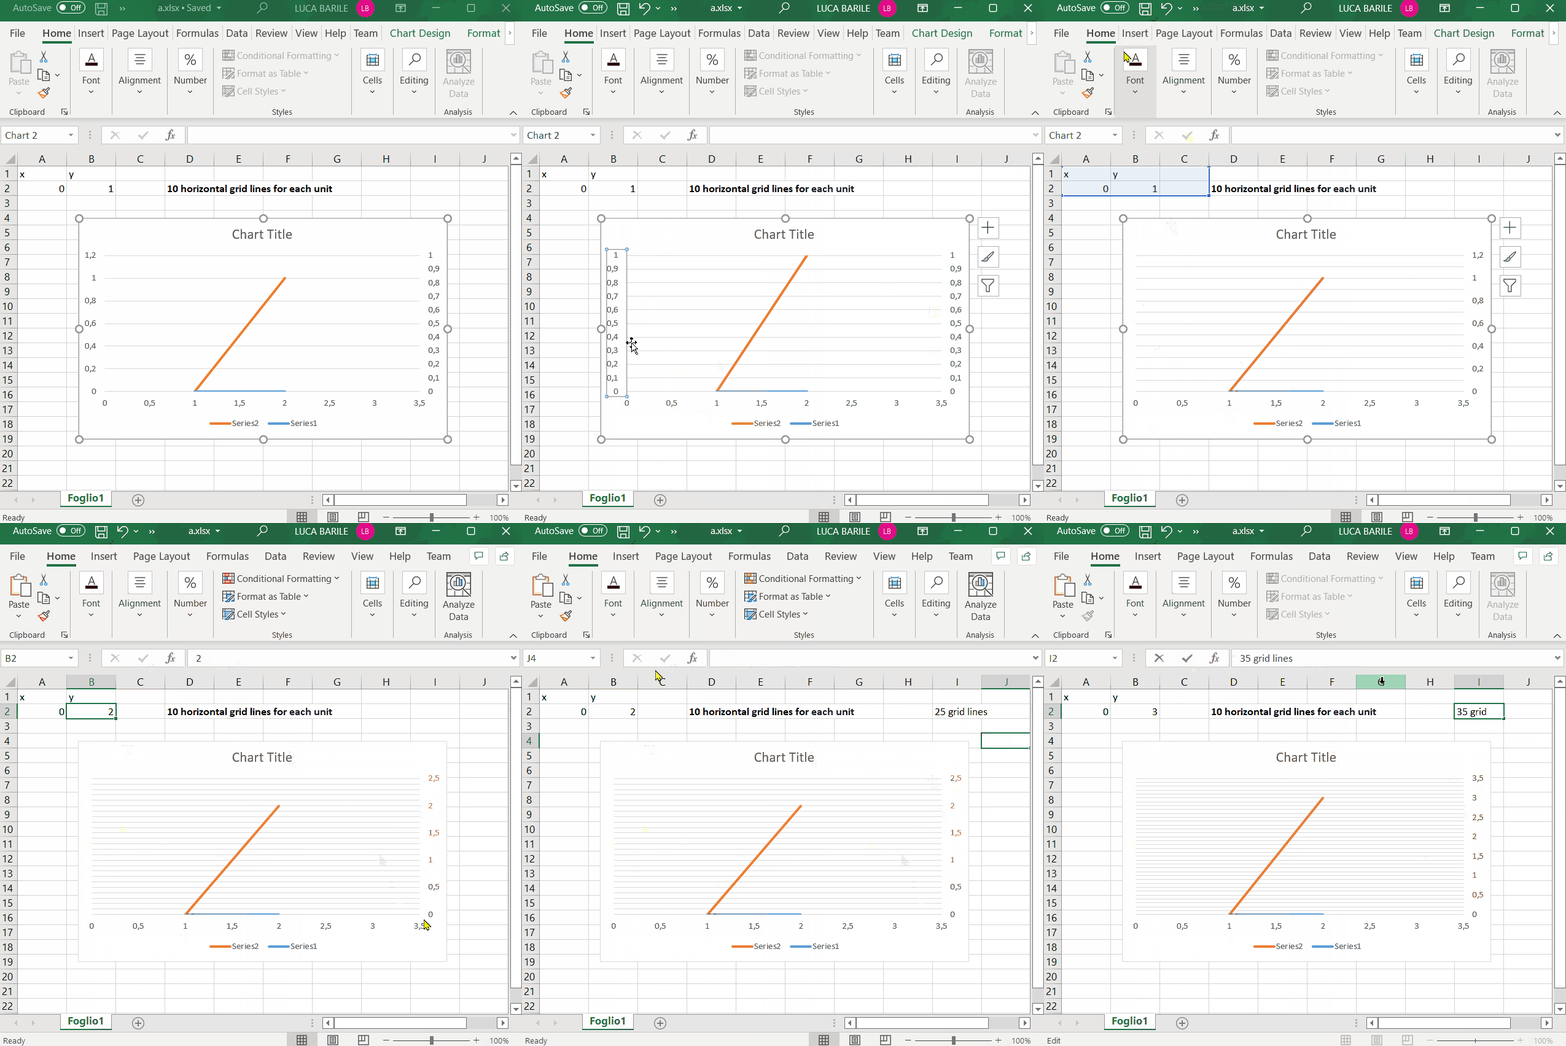
In CASE 1 nothing unexpected has happened: since I deleted the PVVA, Excel, during the creation of the chart, has referred to the Secondary Vertical value axis (which, for simplicity, I'll call SVVA from now on) and, when the chart lines have exceeded its maximum value, Excel automatically changed its scale (because, by default, the SVVA has the maximum value set to Auto) and drew new equidistant (horizontal) grid lines, so that all lines of the chart were entirely visible.
In CASE 2 however, something unexpected happened!
I expected that, also in this case, Excel would behave as in CASE 1 since I deleted the PVVA, therefore its maximum value (which is one of its many properties) should no longer be considered, but I was wrong.
In this case Excel, during the creation of the chart, behaves as in CASE 1 until it has to draw the (horizontal) grid lines: it draws too many lines!
Looking carefully at what happens it can be seen that, during the creation of the chart, the number of (horizontal) grid lines is calculated as if they were to be displayed on the PVVA, even if it has been deleted.
Before deleting it, the number of (horizontal) grid lines established by Excel was (I don’t consider the first grid line to simplify calculations) 10 for each unit (the number is decided by Excel based on the maximum value of the PVVA, so that the (horizontal) grid lines are neither too many nor too few), and that value was a fixed value because, since the PVVA had a maximum value, its scale would never change (because only the part of the chart that falls within its maximum value would have been displayed).
This means that if the user sets the maximum value of the PVVA and then decides to delete the axis, when the chart lines exceed the maximum value of the SVVA, Excel changes its scale to be able to display all lines of the chart but, mistakenly, continues to use the fixed value used to draw the (horizontal) grid lines of the PVVA (10 for each unit of the axis) also to draw the (horizontal) grid lines of the SVVA.
Since the fixed value of (horizontal) grid lines established by Excel was 10 for each unit, an increase of n unit in the SVVA corresponds to an increase of 10*n grid lines to be displayed in the chart, as shown in the following table:

SVVA unitsGrid lines drawn
110
1,212
220
2,525
330
3,535
......
n10*n

Below you can see the unexpected way Excel handles the CASE 2:

Ok... Excel, in this particular scenario (CASE 2), doesn't handle (horizontal) grid lines well, but this wasn't enough to trigger the vulnerability because, except this, it continued to work properly. Can we say: "close but not cigar"? 🚭

Lots of grid lines! Lots and lots!! 📈

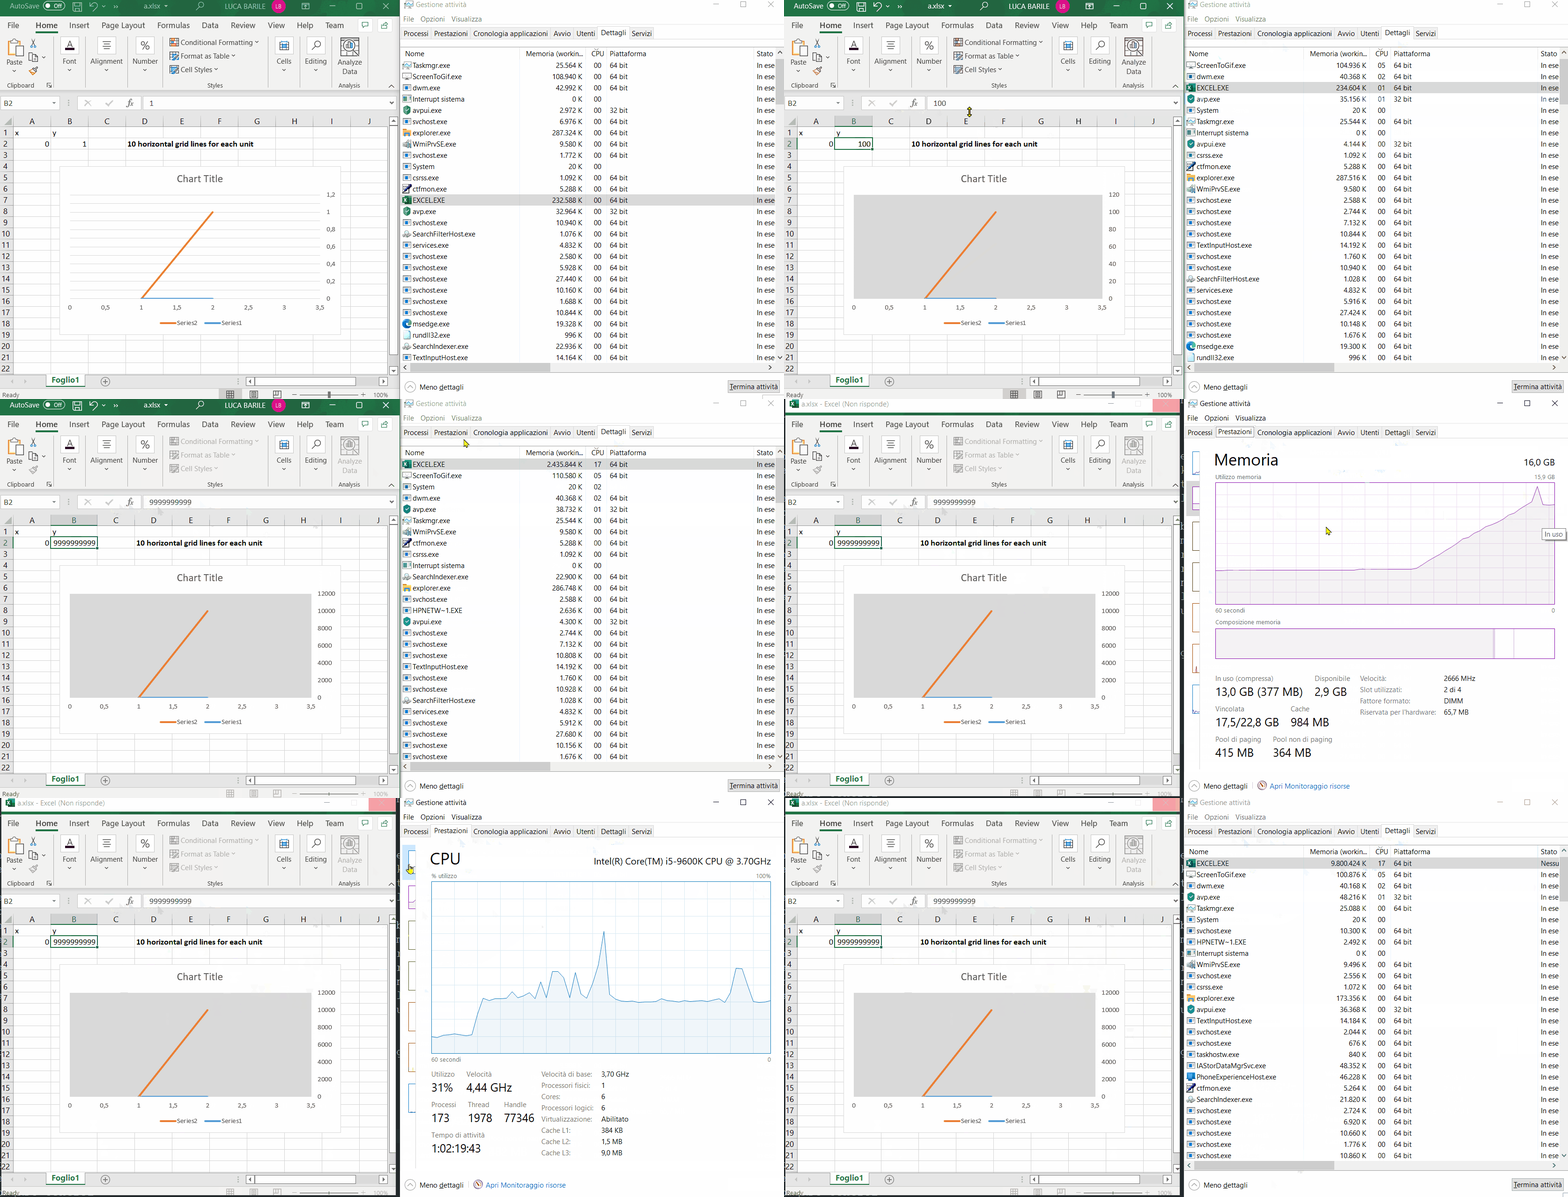
Continuing to increase the number of grid lines we can see that, at some point, there will be so many to have the impression that the chart has a gray background.
Adding even more grid lines, Excel will stop responding for a certain period of time, after which it will resume working normally but with an increasingly higher working set.
Finally, as you can see below, when the number of grid lines exceeds a certain threshold, Excel will no longer respond and will run out of memory, causing a Denial of Service condition on the system:

I collected the following data (on a system with 16GB of RAM and an Intel Core i5-9600K CPU @ 3.70GHz) to understand how Excel's non-response time and its working set changed according to the number of grid lines, setting, as in the previous examples, the maximum value of the PVVA to 1 (<c:max val="1"/>):

Grid lines number Working set Non-response time Prolonged DoS
1 000 000 1.2 GB ∼1 seconds NO
5 000 000 5.1 GB ∼6 seconds NO
5 500 000 5.25 GB ∼6.5 seconds NO
6 500 000 7.4 GB ∼9 seconds NO
7 000 000 8.82 GB ∼11.5 seconds NO
10 000 000 10.95 GB ∼17 seconds NO
UNKNOWN THRESHOLD EXHAUSTED YES
99 999 999 999 EXHAUSTED YES

I don't know if there is an exact number of grid lines (UNKNOWN THRESHOLD) beyond which, regardless of PC hardware performance, Excel will always end up in an infinite loop and will never be able to draw them all. Surely, however, in traditional domestic PCs of 2023, it's possible to make it draw a sufficiently high number of grid lines to bring the system into a very prolonged DoS condition.

We were finally able to reproduce the Excel's vulnerable condition from scratch and exploit it ✅
In a nutshell:

The Exploit ☠️

The exploit consists of a specially crafted .xlsx file which, once opened, exploits the vulnerability as I just described, bringing the system into a DoS condition.
To craft it we can think of reproducing the steps shown in the previous animation, setting the value in cell B2 to a very big number (eg 99999999999) and saving the file. The problem is that, as soon as we set that value, the vulnerability is immediately triggered, Excel stops responding and we can't save the file because we will no longer be able to interact with its graphical interface.
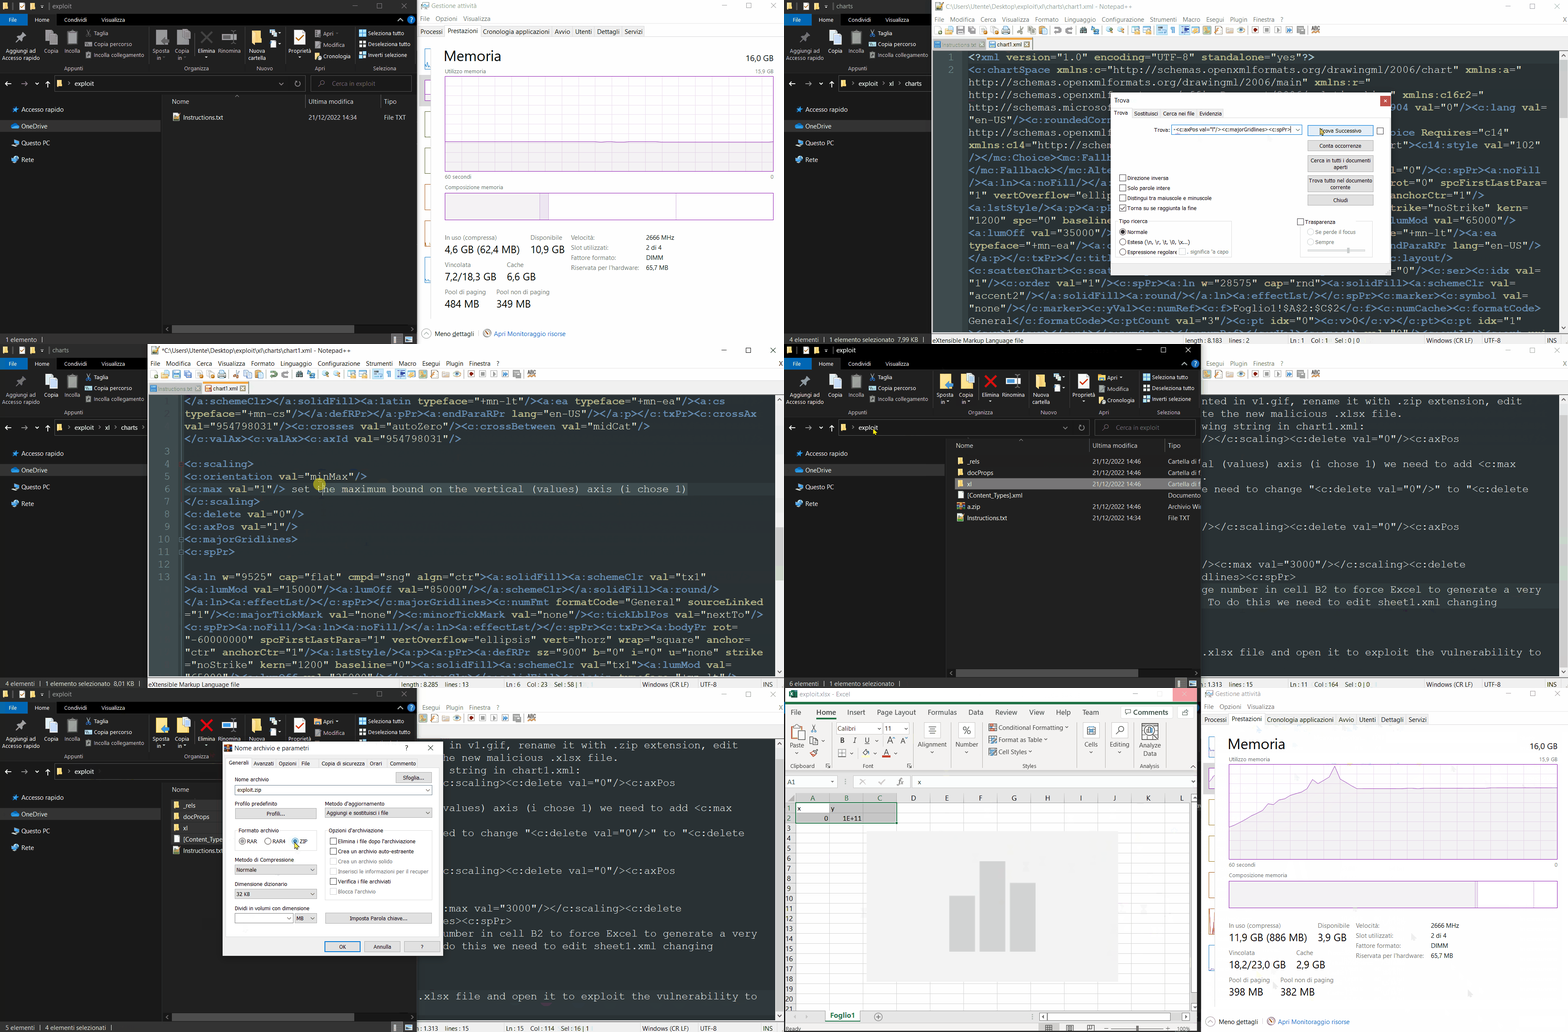
To circumvent the problem we can create a new .xlsx file, a chart as shown here, save the file and directly edit the .xml file related to the chart (chart1.xml) and the spreadsheet (sheet1.xml).
To get the vulnerable condition we must insert the tags <c:delete val="1"/> and <c:max val="1"/> in ...\xl\charts\chart1.xml, while to set a high value (99999999999 in my case) in cell B2 we must insert the tag <c r="B2"><v>99999999999</v></c> in ...\xl\worksheets\sheet1.xml.
After the appropriate changes it will be sufficient to zip the new files and change the extension of the zipped file to .xlsx. Opening the file, the vulnerability will be triggered immediately.
These are the steps to follow to craft our exploit:

Here you can download my exploit.

What the hell are the threads doing? 😒

With this paragraph, which concludes the descriptive part of the vulnerability, I want to delve a little deeper into what happens when Excel tries to draw a very large number of grid lines within a limited space.
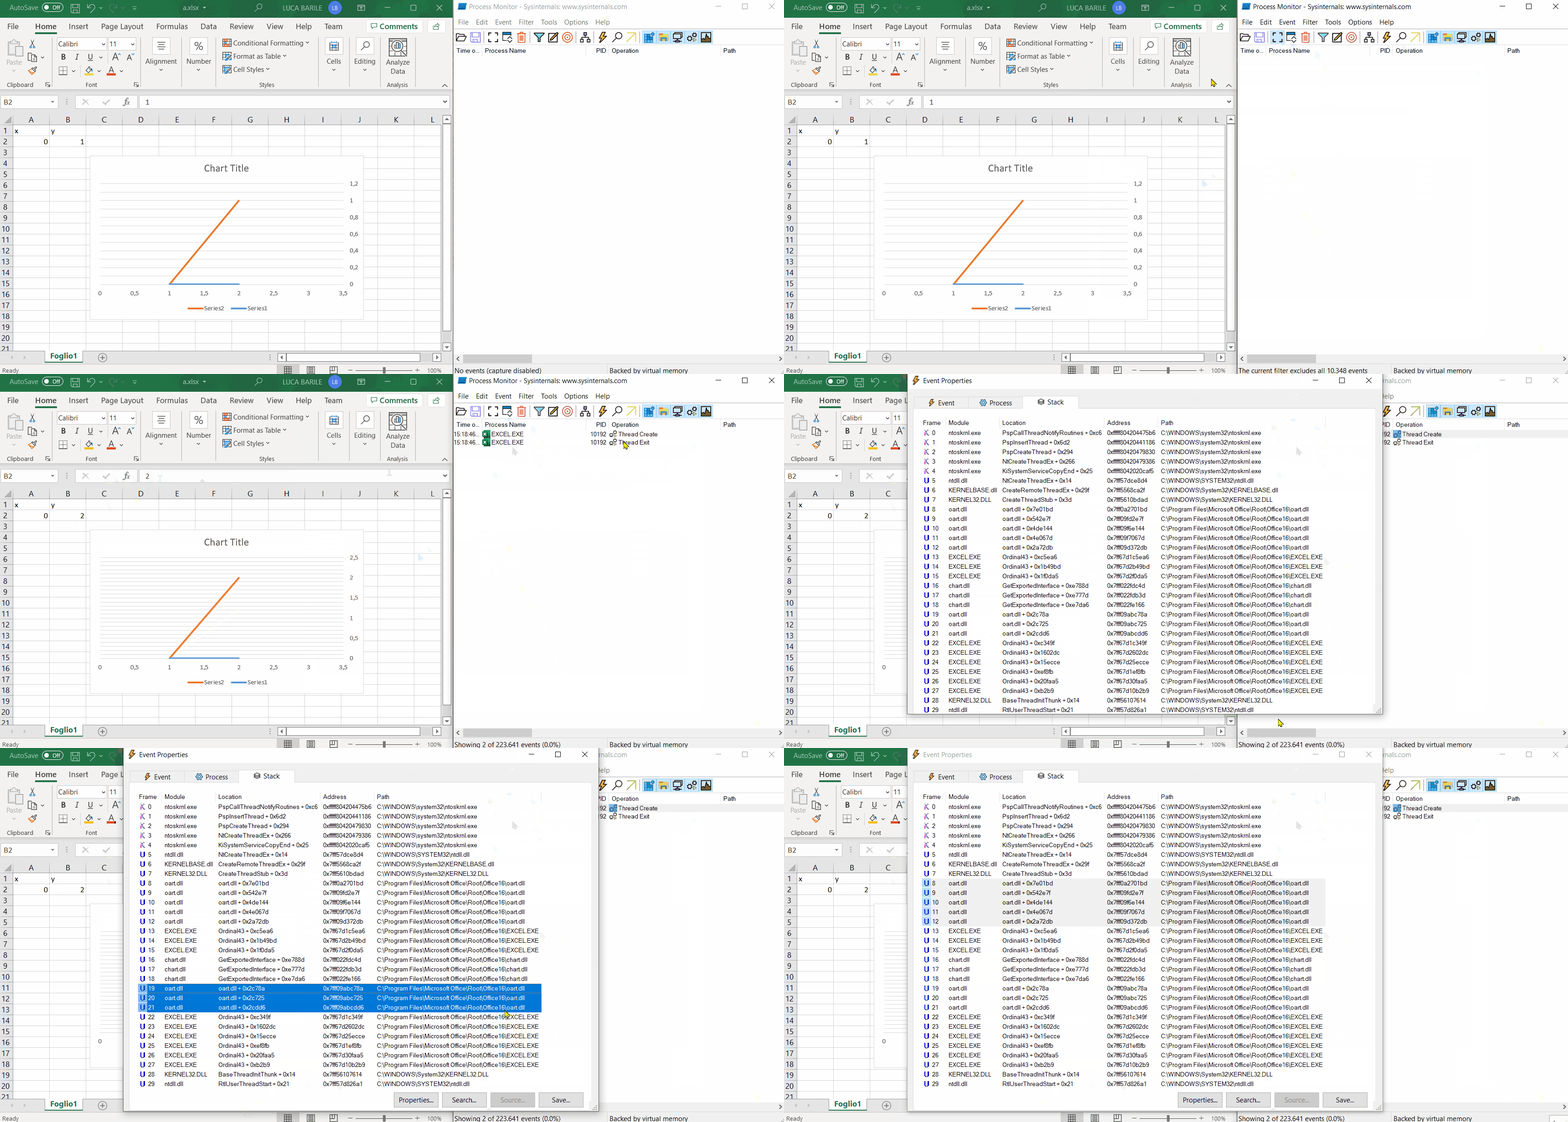
As you can see from the animation below, using Process Monitor it's possible to see that, when Excel has to load or modify a chart, it creates a new thread (Thread Create) to which delegate the task (which also consists, among other things, of drawing the grid lines), in order to be ready to manage any user interactions with the spreadsheet.
To perform its task the thread needs to call some functions, including Ordinal43+0x..., oart.dll+0x... and GetExportedInterface+0x....
Ordinal43+0x... is already loaded within the EXCEL.EXE module while oart.dll+0x... and GetExportedInterface+0x... functions are implemented, respectively, within the oart.dll and chart.dll modules (which, consequently, must be loaded into memory).
As reported here (and as the name itself suggests), oart.dll (Microsoft OfficeArt) provides graphics features that are shared between Office apps, while chart.dll (Microsoft Office Charting) exports many functions that provide support for interacting with charts and graphs, and this is just what the thread needs.
If everything goes well, the thread performs its task successfully, terminates its execution (Thread Exit) and the user can see the chart in the spreadsheet.

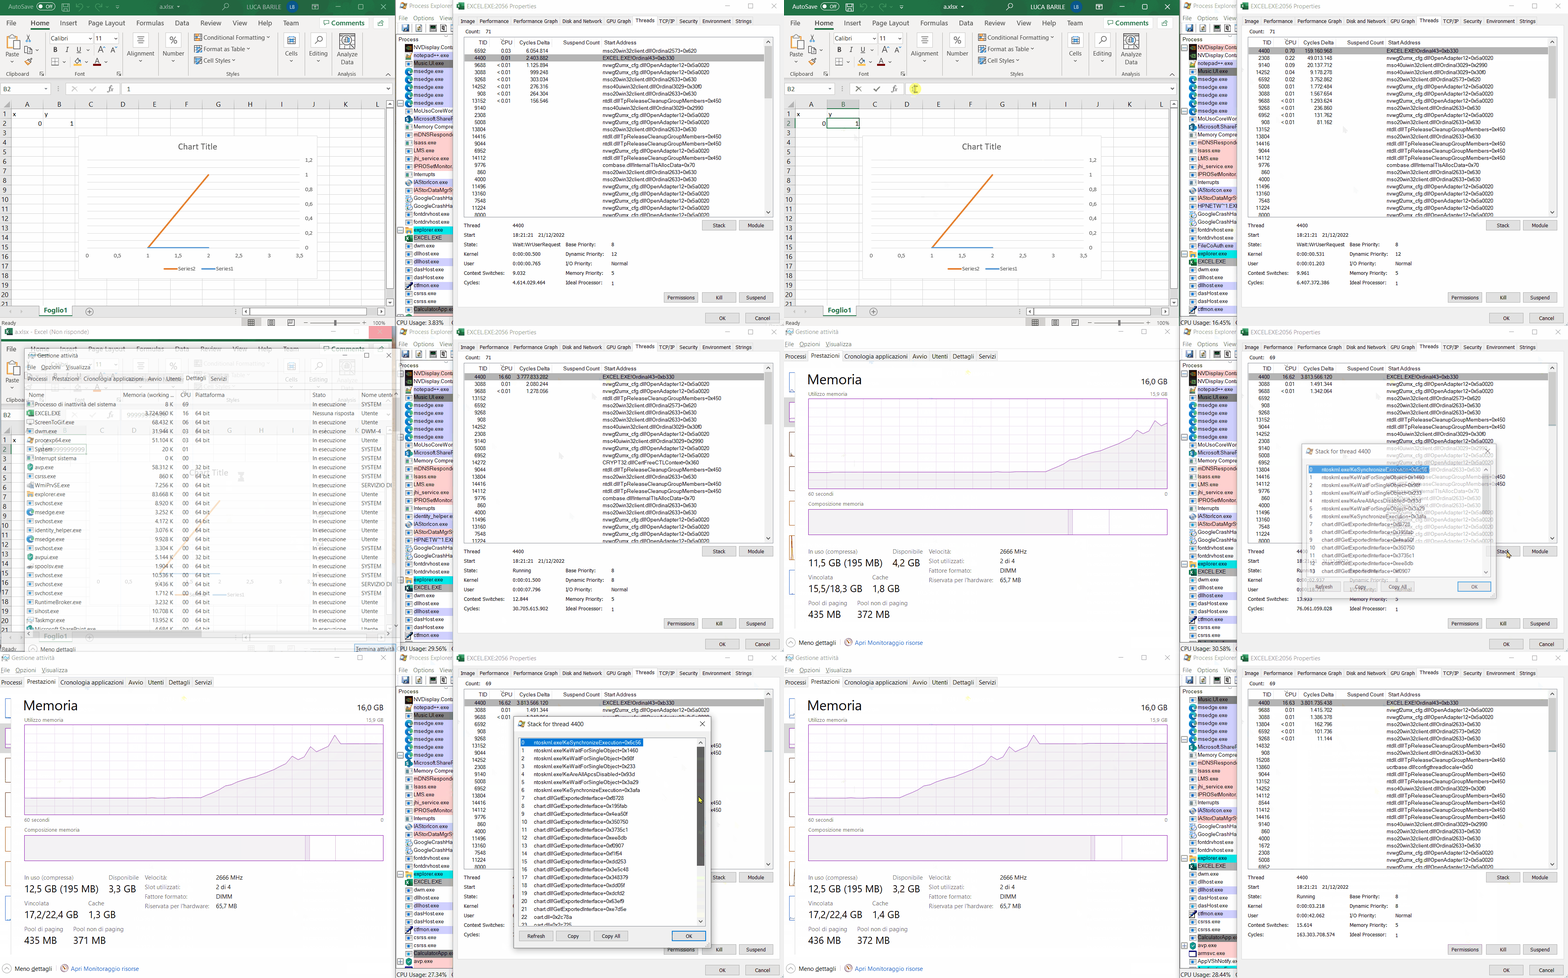
However, if Excel must load a chart with billions of grid lines within a limited space, the thread fails to perform its task and other threads are created and terminated after a while. In particular, the thread with starting address Ordinal43+0xb330, increases more and more its number of Delta Cycles and the CPU \ RAM usage.
Using Process Explorer it's possible to examine the thread activity and see that, after several calls to functions GetExportedInterface+0x..., ntoskrnl.exe calls functions KeSynchronizeExecution, KeWaitForSingleObject and KeAreAllApcsDisabled.
From these calls we can assume that ntoskrnl.exe synchronizes the thread's task with the Interrupt Service Routine (KeSynchronizeExecution), puts it in a waiting state until it reaches the time limit or the dispatcher reactivates it (KeWaitForSingleObject), checks if it's inside a guarded region (KeAreAllApcsDisabled), puts it back in a waiting state and resynchronizes it with the Interrupt Service Routine.
The thread will never get out of its waiting state, will exhaust almost all the available RAM and will continue to use the CPU intensively, causing a DoS condition on the system.

While the DoS problem is triggered by the representation of a very large number of grid lines within a limited space, I suppose it can be split into at least two sub-problems:
  1. The mere operation of drawing a grid line which, repeated many times (99 billion in the case of the exploit just described), could require a lot of RAM and time.
  2. All the operations necessary to be able to draw the grid lines in a limited space, including the calculation of the distance that must exist between one line and another.
I suppose that point 2 could be even more problematic because, as we've seen here, Excel is coded to draw the grid lines so that they're equidistant from each other. This means that by increasing their number in a limited space, their distance decreases very quickly, forcing Excel to perform calculations and operations with very small decimal numbers.
Let's continue to consider the previous animation in which Excel, due to its vulnerability, for each additional SVVA unit adds 10 grid lines (I don’t consider the first grid line to simplify calculations) to the already existing ones, and look at how their distance changes (knowing that they must be drawn equidistant from each other) as a function of the increase in units of the SVVA.
If we assume that the height h of the chart is 1, the thickness of the lines is negligible and we suppose to add the new lines between the first and last line to simplify calculations then, to draw n equidistant grid lines we must distance them by a distance d equal to h\(n+1) from each other.
Since in our case Excel adds 10 grid lines for each SVVA additional unit, we get the following values:

SVVA units Grid lines number (n) Grid lines distance (d)
1 10 0.090909090
10 100 0,009900990
100 1000 0,000999000
1000 10 000 0,000099990
10 000 100 000 0,000009999
100 000 1 000 000 0.000000999
1 000 000 10 000 000 0.000000099
... ... ...
99 000 000 990 000 000 0,000000001

We can see how, by greatly increasing the number of grid lines, their distance will asymptotically converge to zero without ever reaching it, and a decimal overflow could occur in the decimal variable which stores their distance value (if it's stored as a mantissa and an exponent) because it could no longer be represented by the exponent portion of the decimal representation.
This could lead to some memory corruption issue or infinite loop... But this is just an assumption, and I didn't investigate it any further.
Open questions ❓❓

Although the vulnerability and the way to exploit it are clear, there're still some questions to which it would be interesting to find the answer:
  1. Is my above assumption (regarding the sub-problem 2) correct?
    If not, what's the root cause that, during the grid lines representation, brings the system into a prolonged DoS condition? Thread deadlock / starvation? Infinite loop? Memory corruption (Overflow / Underflow / Use After Free / ...)?
  2. Assuming that the maximum value of the PVVA is set to 1, is there an exact number of horizontal grid lines (a sort of threshold) beyond which, regardless of PC hardware performance (CPU, RAM, ...), Excel will always end up in a DoS condition and will never be able to draw them all?
    If so, what is it? And why?
    If not, will the chart be drawn correctly? Is it just a matter of time, RAM and computing power?
  3. Aside from the DoS attack, can the vulnerability be exploited to perform other types of attacks such as Remote Code Execution or Information Disclosure? If yes, how?
If you have the answer to one (or more) of these questions and would like to share it with me and the readers of this write-up, write to me at luca.barile.research@gmail.com; I'll add your answer to this paragraph ASAP.

How to fix the vulnerability 🚑

The vulnerable condition can be reached in the following two ways:
  1. The user creates a chart in which the SVVA is visible, sets the maximum value of the PVVA and deletes it.
  2. An attacker reproduces the situation described in point 1 by directly modifying the .xml file related to the chart (chart1.xml) and creating a specially crafted .xlsx file, as shown here.
To prevent the achievement of the vulnerable condition I propose, respectively, the following fixes:
  1. When the user deletes a chart axis in which the maximum value has been set, Excel must reset that value to the default value (Auto).
  2. When Excel parses the .xml file related to a generic chart, it must check that none of the chart's axes is not visible (<c:delete val="1"/>) and with a maximum value set (<c:max val="some_number"/>) at the same time.
    If both conditions are true at the same time, Excel must do one of the following:
    • Treat the file as invalid, show an error to the user and close the file (the best option in my opinion).
    • Fix and open the file.
      To fix the file Excel must reset the maximum value of the axis to the default value (Auto). To do this, it must delete the <c:max val="some_number"/> tag from the .xml file (if Excel doesn't find that tag among the various tags that define the properties of an axis, it sets the maximum value of the axis to Auto).

Vulnerability disclosure timeline 📅

All dates are reported according to the Italian Time Zone.
Here you can find the Microsoft Bug Bounty Programs and check if your submission type is eligible for Microsoft Bounty Awards.
Here you can report your vulnerability opening a new case.
Here you can see the possible case statuses and understand how long you have to wait (indicatively) for the patch release.

Patch analysis 🩹🔍

Microsoft released the following fixes on 2023-03-14: On 2023-03-23 I updated Microsoft Excel to the latest version (Microsoft Excel for Microsoft 365 MSO (Version 2208 Build 16.0.15601.20540) 64-bit) and tested the exploit again.
The exploit also worked correctly in the updated version of Excel installed on my PC, so I notified Microsoft.
On 2023-04-05 Microsoft replied as follows:
"MSRC has investigated this issue and concluded that while your report is valid, this does not require immediate servicing, as the attack results in a local client denial of service. As no further action is required by the MSRC, I am closing this case."
This means that, at the time of writing (2023-04-07), the server versions of Microsoft Office (Microsoft Office Web Apps Server 2013 Service Pack 1 and Microsoft Office Online Server) have been fixed (via KB5002362 and KB5002356, respectively) but, the client version is still vulnerable, so the exploit results in a 0-day for it.

Conclusion

PS
In the end, the student who unintentionally triggered the Excel vulnerability, passed the test, achieving a positive score both in the Excel assignment and in the global test evaluation ✅

References 🔗

The references that have been useful to me to write this article and the exploit code are already present, in the form of links, in the previous paragraphs you have read and that make up this article.
The vulnerability was also published on the following web pages: I published my exploit here.


If you liked this article, what do you think about buying me a unicorn? Yeees! I'll buy it for you! 🦄